Integrate Service Telemetry
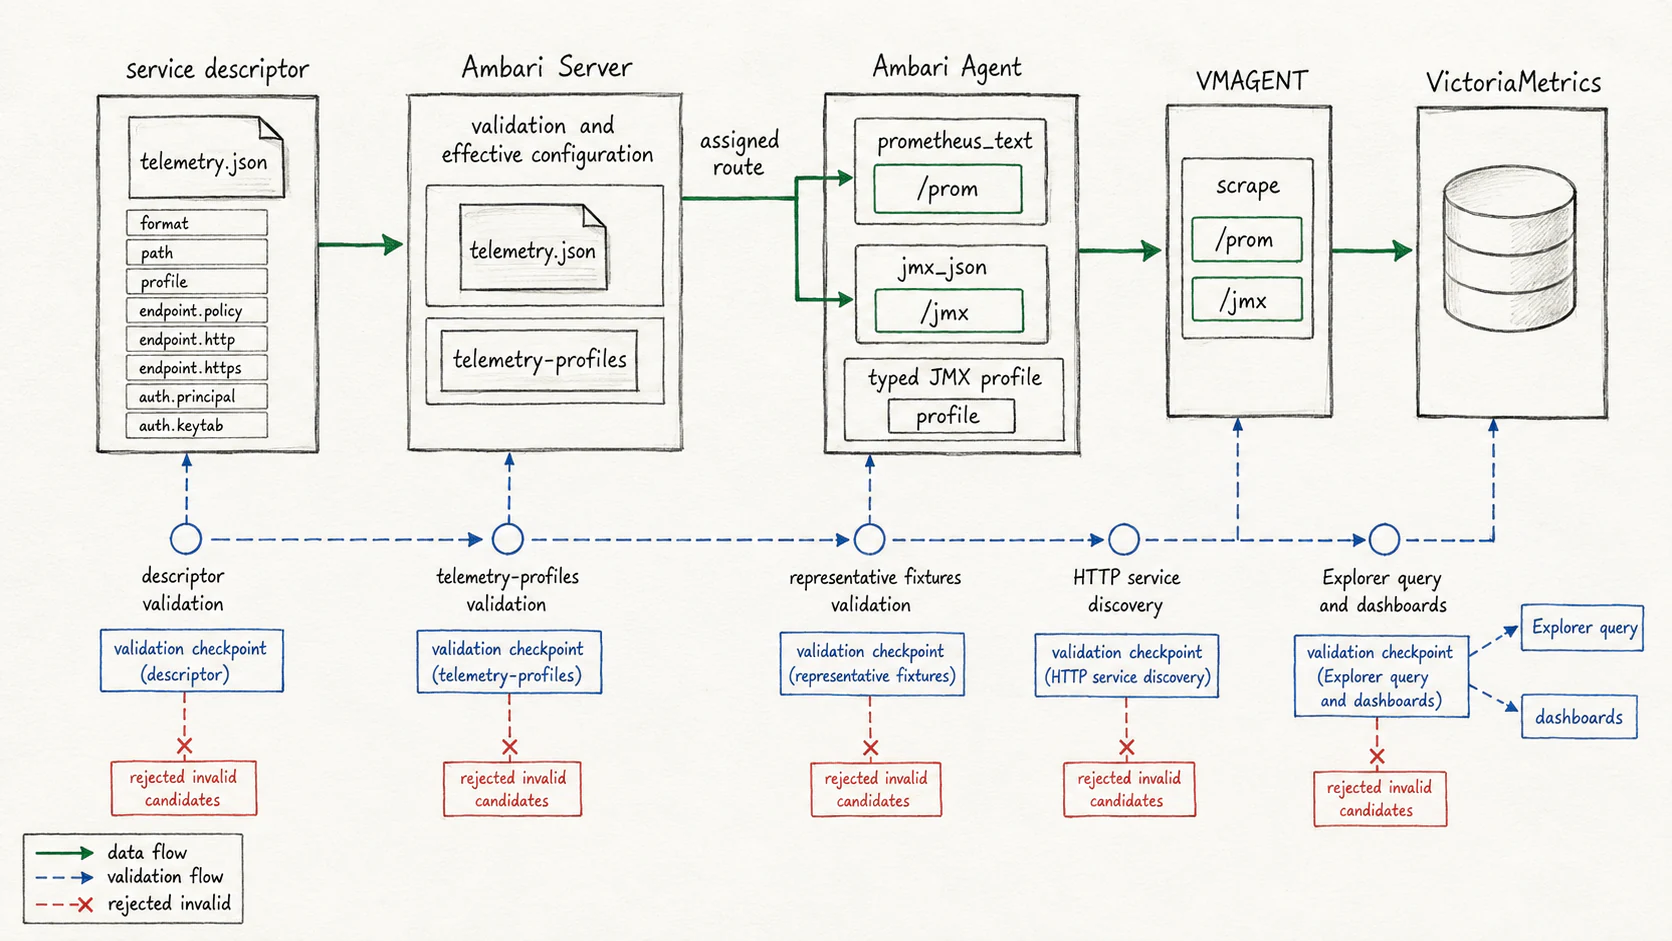
| Descriptor field | Meaning |
|---|---|
format | prometheus_text for native exposition or jmx_json for typed conversion |
path | The component's known endpoint, such as /prom or /jmx |
profile | Service-relative typed JMX profile when using JMX |
endpoint.policy | Effective configuration that selects HTTP versus HTTPS |
endpoint.http / endpoint.https | Configuration property, optional HA property prefix, and default port |
auth.principal / auth.keytab | Effective-configuration references for Kerberos, not embedded secrets |
The Server chooses the component host as the destination and extracts the configured port. Descriptor/profile validation rejects unsupported formats and unsafe routes. The Stack service inheritance mechanism also applies to telemetry metadata.
Native Versus JMX
The baseline uses native Hadoop /prom for NameNode, DataNode, and ResourceManager. The property hadoop.prometheus.endpoint.enabled=true enables that native endpoint where supported.
NodeManager intentionally uses its stable Web UI /jmx endpoint in the Hadoop 3.3 contract. A process containing an in-process Timeline Collector can attach the global Prometheus sink elsewhere, leaving the expected NodeManager Web UI /prom empty. Do not replace this route merely because another Hadoop component supports native exposition.
HBase Master, HBase RegionServer, and HiveServer2 also use typed JMX profiles in the documented baseline. A newer component version or another native endpoint requires output and authentication validation before changing its descriptor.
A Typed Profile
This reduced example shows one rule from the packaged NodeManager profile. The production profile contains more rules; extend a reviewed profile rather than replacing it with this excerpt.
{
  "schemaVersion": 1,
  "id": "nodemanager-3.3",
  "maxSeries": 64,
  "rules": [
    {
      "bean": {
        "domain": "Hadoop",
        "properties": {
          "service": "NodeManager",
          "name": "NodeManagerMetrics"
        }
      },
      "attributes": {
        "ContainersRunning": {
          "name": "yarn_nodemanager_containers_running",
          "type": "gauge",
          "unit": "containers",
          "help": "Current number of containers running on the NodeManager."
        }
      }
    }
  ]
}
Match explicit ObjectNames and numeric attributes. Define stable metric names, correct types and units, and bounded series counts. Counter names use the _total suffix. Do not convert every JMX property into an unbounded label.
Registration And Validation
- Add or update the service's descriptor and, for JMX, its
telemetry-profilescontent. - Verify effective configuration resolution for normal, HA, HTTP, HTTPS, and Kerberos variants supported by that component.
- Supply representative native or JMX response fixtures. Check successful conversion and rejected malformed, oversized, duplicate-series, and unmatched responses.
- Include the metadata in the Server/Stack package and follow its normal deployment lifecycle. Use supported configuration/component changes to trigger assignment recompilation.
- Confirm the assigned route through HTTP service discovery, scrape the actual route, and query the resulting metric in the Explorer.
- Add dashboards using the emitted names and units, then test active/standby and failure behavior.
Assignments are complete, hashed bundles, and the Agent keeps its last valid configuration if a candidate is invalid. That recovery behavior must not be confused with successful acceptance of a new descriptor.
Keep Management Signals Separate
The retained metrics.json files define a small set of direct-JMX attributes needed by management operations, not the new historical monitoring definition. Examples include NameNode HA state, cluster ID, safe mode and checkpoint information, JournalNode journal state, and HBase active-master/live-server information.
Do not remove these attributes while migrating a service to telemetry.json: management workflows can depend on them even when the monitoring dashboard uses Prometheus queries.
Source Examples
Consult the pinned HDFS descriptor, YARN descriptor, and NodeManager profile.