How Monitoring Works
Ambari 3.1.0 collects Linux host metrics and metrics from selected Hadoop, HBase, and Hive processes. Server decides what is collected, the Agent exposes endpoints, VMAGENT fetches samples, and VictoriaMetrics stores and queries them. The web application reaches the query service through Ambari, so browsers need neither VictoriaMetrics credentials nor direct network access.
A sample is a metric value at a particular time, such as a host's available memory. A time series is the history of one metric with the same labels; labels identify the cluster, host, or component. VMAGENT periodically asks each endpoint for fresh samples. This is called a scrape.
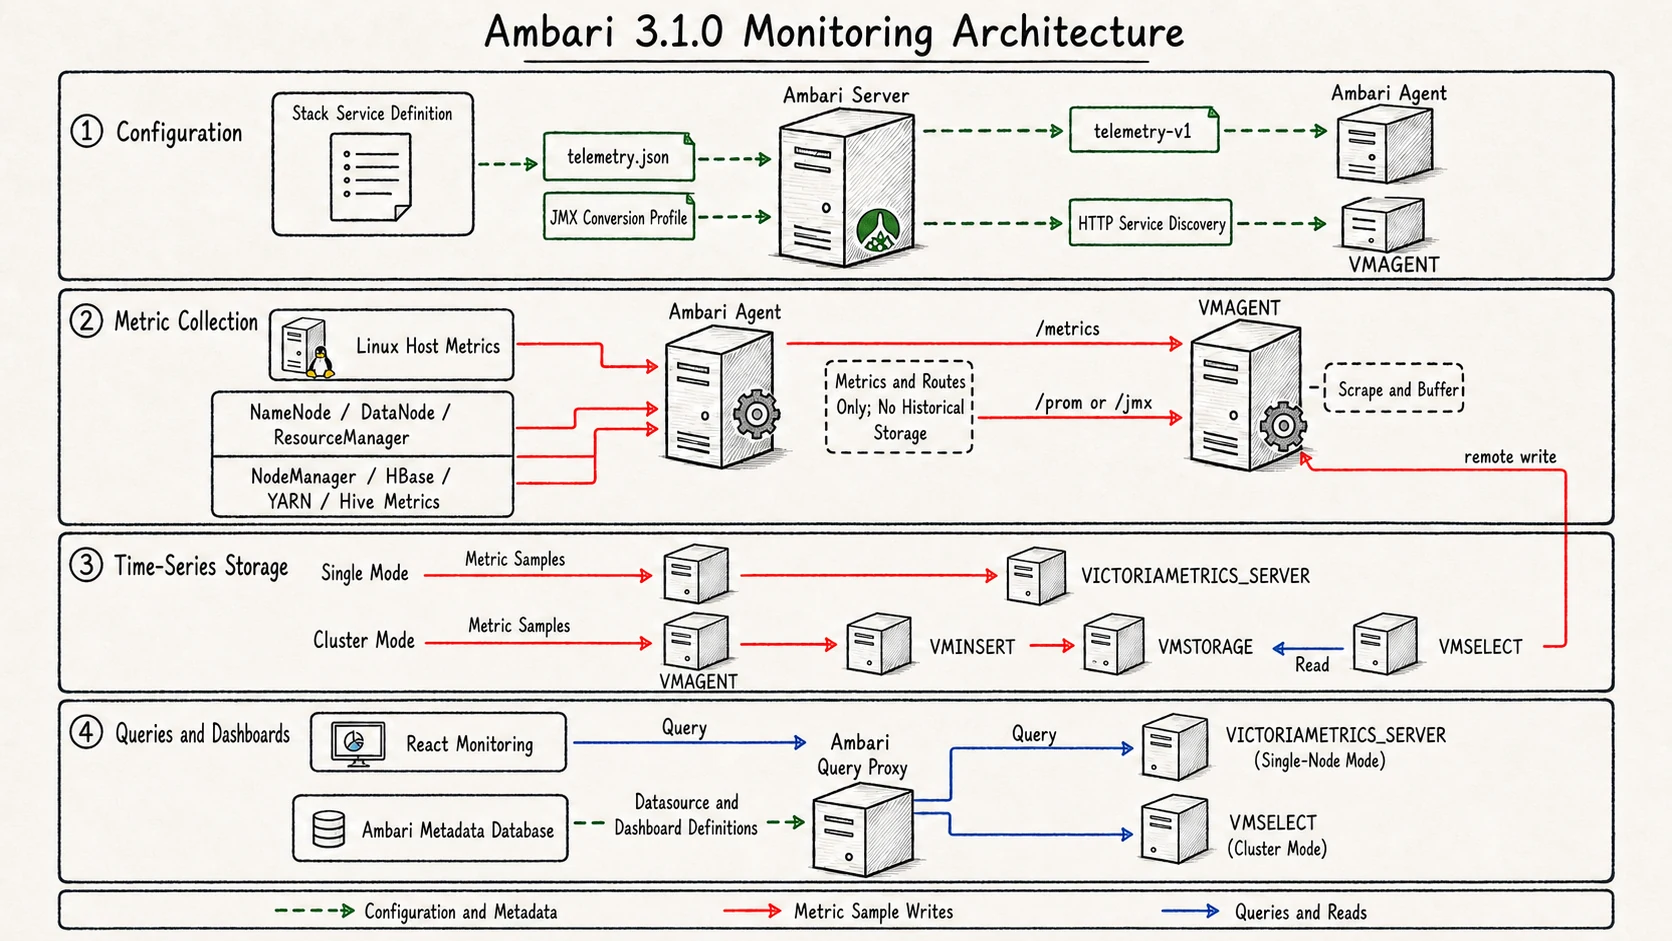
Configuration is distributed separately from metric samples. Queries return stored history through Ambari rather than connecting browsers directly to VictoriaMetrics.
Configuration stays separate from metric values: Server metadata describing each host, endpoint, limits, and optional JMX profile is assigned to the Agent; component values are requested during each VMAGENT scrape, never cached by the Agent or included in heartbeat messages.
What Each Component Does
| Component | Responsibility | What it retains |
|---|---|---|
| Stack service definitions | Describe which component endpoint to read and how to translate JMX responses | Descriptors and JMX conversion profiles shipped with the Stack |
| Ambari Server | Resolve configuration, publish the target list, authorize queries, and manage dashboards | Management configuration and dashboard/datasource definitions in its metadata database |
| Ambari Agent | Read Linux host statistics and fetch assigned component metrics on demand | Last valid sampling configuration; no history of metric values |
| VMAGENT | Discover targets, scrape endpoints, filter/label samples, and send remote writes | A local delivery queue for samples awaiting storage |
| VictoriaMetrics | Store historical samples and execute queries | Time-series data according to the configured retention policy |
| VMAUTH, optional | Provide an authentication and routing gateway before storage writes and queries | Gateway configuration, not metric history |
| React monitoring pages | Display target health, queries, and dashboards through Ambari APIs | Dashboard edits are persisted through Ambari, not as browser-only history |
Ambari Agent and VMAGENT are different processes. The first already runs on managed hosts and exposes metrics. The second is a collector deployed as part of the monitoring service; it requests those metrics and forwards them to storage. A separate VMAGENT on every managed host is not required.
How Sampling Configuration Reaches Hosts
Stack telemetry.json descriptors are the monitoring contract. They identify
the component endpoint (/prom or /jmx), effective configuration keys,
optional HA property prefixes, limits, and a typed JMX profile. Profiles select
specific JMX ObjectNames and numeric attributes, convert units, apply
Prometheus names, and cap the number of output series. Dynamic ObjectNames
are not labels unless a profile declares a bounded label source.
Ambari Server validates descriptors and profiles, resolves the effective host
configuration, selects the configured port and HTTP or HTTPS scheme, resolves
HA-suffixed properties, and substitutes _HOST in Kerberos principals. It
generates a stable route ID for every assigned component endpoint. That ID
cannot be used to select an arbitrary URL; unknown routes return 404. URLs
cannot contain credentials, query strings, or fragments.
An assignment contains component, service, host, format, URL, timeout,
response-size and concurrency limits, authentication references, and profile
hashes. The Server sends it through the existing telemetry-v1 STOMP
capability at /telemetry. The Agent retains only the active assignment and
the referenced profiles, identified by a checksum of their contents.
Assignments are rebuilt after cluster configuration changes, component or host installation/removal, and completed Stack upgrades. Agent registration compares hashes immediately, while a five-minute reconciliation recovers a missed event without restarting Server or Agent.
The Agent validates the whole update before using it. It writes profiles and
configuration through temporary files, fsync, and atomic rename so that an
interrupted update does not replace a working configuration with a partial
file. Invalid or incomplete updates leave the previous valid configuration
active. Startup also checks the referenced profile checksums.
Collecting Host And Component Metrics
The Agent exporter is enabled by default on Linux and normally listens on
0.0.0.0:9101 (the ambari-agent.ini [prometheus] section controls this).
A malformed or out-of-range port falls back to 9101; a bind failure stays in
the exporter thread and does not terminate the Agent process.
| Endpoint | What it returns |
|---|---|
/metrics | Linux host metrics and exporter self-metrics |
/metrics/components/{routeId} | One assigned component target |
/-/healthy | Exporter process health |
Host collectors read /proc and statvfs for CPU, memory, swap, load, uptime,
boot time, process states and aggregate process threads; filesystems and
inodes; disk operations and throughput; network traffic, errors and drops; context switches,
interrupts, file descriptors, entropy, OOM kills, conntrack, and TCP states.
Optional kernel files are omitted independently. No per-process, command-line,
socket, user, or container labels are emitted, keeping cardinality bounded.
VMAGENT requests HTTP service discovery from
GET /api/v1/clusters/{cluster}/prometheus_targets. Server returns one target
group for each host exporter and component route. __metrics_path__ selects
/metrics or the independent route. Authoritative target labels are
cluster, host, service, component, and ambari_target; host targets
intentionally have no service or component label. VMAGENT then performs the
HTTP scrape, applies its allowlist and relabeling, and remote-writes samples.
One Collection Cycle
For a host running a DataNode, one collection cycle works as follows:
- VMAGENT obtains the host endpoint and the separate DataNode endpoint from the Server target list. They can share one Agent address but use different paths.
- VMAGENT requests the host endpoint. The Agent reads current Linux counters and returns host samples.
- VMAGENT separately requests the assigned DataNode route. The Agent fetches that DataNode's endpoint at that moment and validates its response.
- VMAGENT attaches the target's cluster and host identity, applies the configured filters, and queues the accepted samples for remote write.
- VictoriaMetrics receives and stores those samples. A later dashboard query reads this stored history, rather than asking the DataNode to reconstruct past values.
The managed defaults refresh discovery every 30 seconds and scrape every
30 seconds with a 10-second scrape timeout. The Agent's own component request
timeout is separate and defaults to 5 seconds. The Server's configured
prometheus.agent.metrics.port must match the Agent exporter port.
For native output, the Agent validates non-empty UTF-8 Prometheus text and
passes names and labels through unchanged. For JMX, it parses a JSON beans
array, matches structured ObjectNames, renders numeric values, omits
missing attributes, and rejects invalid JSON, duplicate series, no profile
match, or excessive series.
Component Collection
The initial BIGTOP 3.2.0 Stack integration covers these seven components:
| Component | Endpoint and default port | Agent processing |
|---|---|---|
| HDFS NameNode | native /prom | Validate and pass through |
| HDFS DataNode | native /prom | Validate and pass through |
| YARN ResourceManager | native /prom | Validate and pass through |
| YARN NodeManager | Web UI /jmx, 8042/8044 | Typed JMX conversion |
| HBase Master | /jmx, 16010 | Typed JMX conversion |
| HBase RegionServer | /jmx, 16030 | Typed JMX conversion |
| HiveServer2 | Web UI /jmx, 10002 | Typed JMX conversion |
Hadoop native metrics require hadoop.prometheus.endpoint.enabled=true.
NodeManager deliberately uses its stable Web UI /jmx contract in this
integration. Hive selects HTTPS when hive.server2.webui.use.ssl requires it.
Each route is independent, so a failed component does not hide host metrics
or other component routes.
Storage Choices
VMAGENT is the collector in both modes. In single,
VICTORIAMETRICS_SERVER receives writes, stores samples, and serves queries.
In cluster, VMINSERT distributes writes, VMSTORAGE persists samples, and
VMSELECT serves tenant-scoped queries. Optional VMAUTH fronts both paths.
The Agent route concurrency contract limits managed VMAGENT scrape replication
to two members. VictoriaMetrics replication_factor is a separate setting:
it controls copies across VMSTORAGE nodes. With two VMAGENT scrapers, managed
storage uses the scrape interval for deduplication. VMAGENT's local queue can
buffer delivery after a scrape, but it is not an Agent metric-value cache.
Retention, paths, replication, tenant ID (default 0), and topology are
independent Stack settings; Stack derives URLs from topology unless overridden.
Querying And Dashboards
Ambari Server stores cluster-scoped datasource definitions and provides a
bounded Prometheus-compatible query proxy. React calls
/api/v1/metrics/{datasourceId}/api/v1/query and query_range; VictoriaMetrics
receives the query and returns stored samples. Dashboard and datasource
definitions are metadata in Ambari, not time-series samples in VictoriaMetrics.
The UI binds every panel to AppContext.clusterName and uses authoritative
cluster plus ambari_target="host" labels for Linux host queries. Packaged
fleet and host-detail dashboards use ambari_agent_* families, not old
Categraf or Telegraf aliases. Counter panels use rate or increase with a
dynamic interval whose minimum is 120 seconds; gauges are queried directly.
The retained direct-JMX metrics.json values support management decisions,
not dashboards or VictoriaMetrics storage:
| Component | Retained values |
|---|---|
| NameNode | HAState, ClusterId, Safemode, LastCheckpointTime, JournalTransactionInfo |
| JournalNode | JournalsStatus |
| HBase Master | IsActiveMaster, liveRegionServers, deadRegionServers |
These values preserve HA role, safe mode, identity, checkpoint, journal, and
active-master workflows, separate from telemetry.json samples.
Network Access And Permissions
The exporter has no application-level authentication, so bind it to a
monitoring interface or enforce host firewall policy. Service discovery,
datasource and dashboard reads, and metric queries require
CLUSTER.VIEW_METRICS; dashboard persistence requires
CLUSTER.MANAGE_USER_PERSISTED_DATA; datasource administration requires
AMBARI.MANAGE_SETTINGS.
Kerberos assignments contain resolved principals and local keytab paths, never keytab contents or passwords. The Agent Kerberos helper disables redirects, enables HTTP errors, bounds responses, and verifies TLS; its configured CA is inherited when a route has no dedicated CA path. Browser metric queries go through Ambari Server instead of accessing storage directly.
Failure Behavior And Limits
| Failure | What continues working | What to check |
|---|---|---|
| One component is down or returns invalid metrics | Other component routes and Linux host metrics remain independently available | That target's scrape status, component process, endpoint, and authentication |
| A new sampling configuration is invalid | The Agent retains its previous valid configuration | Configuration reload status and Server/Agent logs |
| Agent exporter cannot bind its port | The main Agent process stays running, but that exporter's metrics are unavailable | Port conflicts, bind address, and exporter health |
| Storage is temporarily unreachable | VMAGENT can queue already collected samples for delivery | Queue capacity, local disk, storage availability, and remote-write errors; buffering is not an unlimited durability guarantee |
| A dashboard query fails | Collection is a separate path and may still be running | Datasource URL and credentials, query permissions, time range, and storage query service |
Exporter health alone does not prove that every service was scraped. Inspect
each target's up result and the Agent's route errors, last successful scrape,
JMX conversion failures, and host collector health. Also verify storage
delivery; successful scraping alone does not prove remote write succeeded.
Every route has independent timeout, response-size, concurrency, redirect, authentication, and conversion handling. Defaults are a five-second timeout, 32 MiB response limit, and two concurrent requests per route; allowed bounds are 1..60 seconds, 1 KiB..64 MiB, and 1..16. Over-limit or failed requests return a non-2xx response so VMAGENT records that target as down. Host and other routes remain available.
HTTP service-discovery output is cached by assignment revision and supports ETag revalidation. This is configuration caching only, not sample caching. The query proxy limits query strings to 65,536 characters, range queries to 11,000 points, batches to 64 queries, responses to 16 MiB, request bodies to 8 MiB, and timeouts to at most 60 seconds. Redirects are not followed.
The architecture does not promise legacy aliases, Grafana dashboards, or
Windows host collection. HBase native /prometheus can replace JMX only after
version-specific output and authentication are verified.
Related Guides And Source
See Deployment, Queries and Dashboards, Service Integration, and Migration. The implementation reference is the pinned PR #4182 architecture source.