Queries And Dashboards
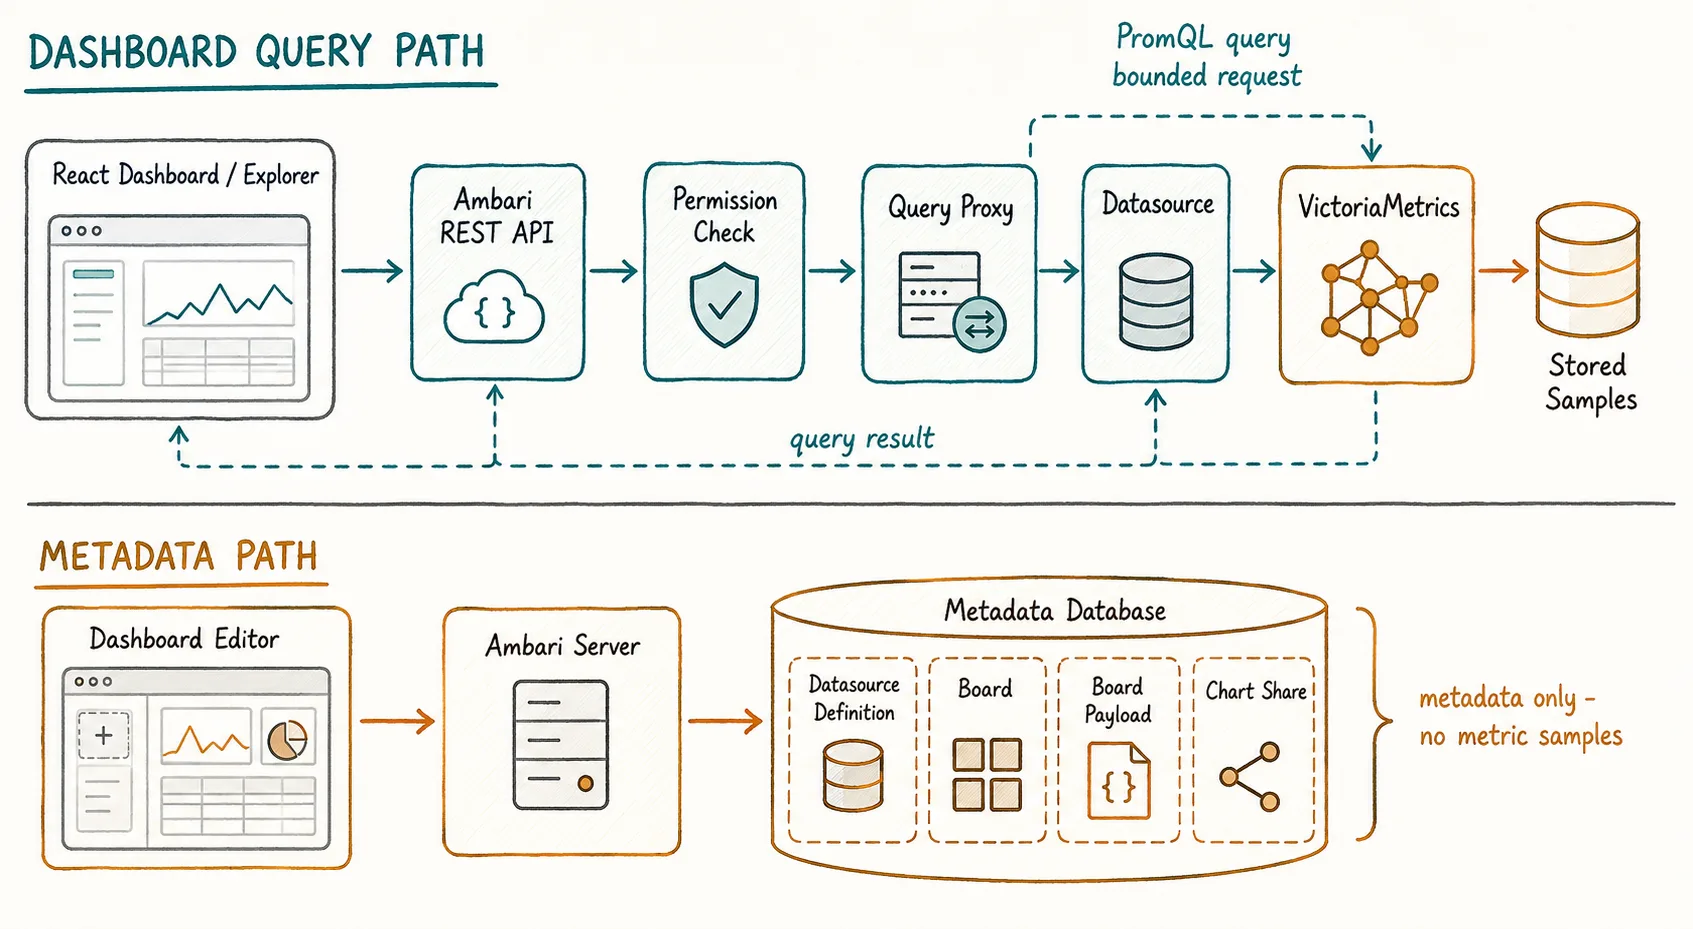
Dashboard and datasource definitions are Ambari metadata. Metric samples remain in VictoriaMetrics and browsers query them only through the bounded Ambari proxy.
| Operation | Required permission |
|---|---|
| Read dashboards/datasources and query metrics | CLUSTER.VIEW_METRICS |
| Open the Targets route | HOST.VIEW_METRICS |
| Open service Metrics tabs | SERVICE.VIEW_METRICS |
| Create/update/delete dashboards | CLUSTER.MANAGE_USER_PERSISTED_DATA |
| Create/update/delete/default a datasource | AMBARI.MANAGE_SETTINGS |
Permissions are also checked by Ambari Server. A visible menu is not authorization to mutate a datasource or dashboard.
Configure A Datasource
- Open Data sources and inspect the cluster's datasource list.
- For an Ambari-managed VictoriaMetrics installation without VMAUTH authentication, check the automatically provisioned default datasource.
- For another authentication or routing topology, create an explicit datasource using the query endpoint reachable from Ambari Server. A VMAGENT ingestion endpoint is not a VictoriaMetrics query endpoint.
- Configure authentication and TLS through the datasource settings, test the connection, enable the datasource, and select the intended default.
- Return to the Explorer and verify a recent query before diagnosing dashboard layout.
A failed datasource test can indicate networking, authentication, TLS, tenant routing, or an invalid URL. Fix the boundary reported by the error rather than disabling certificate verification globally.
Start With PromQL
Select a datasource and a time range. These examples use cluster1; substitute the real cluster label.
up{cluster="cluster1",ambari_target="host"}
A value of one indicates a successful scrape for that target. A missing series differs from an explicit zero: check target discovery and the selected time window as well as exporter health.
ambari_agent_memory_available_bytes{cluster="cluster1",ambari_target="host"}
This gauge reports available memory in bytes. Host queries must include ambari_target="host" so similarly named component metrics cannot be mistaken for host metrics.
sum by (host) (
  rate(ambari_agent_cpu_seconds_total{
    cluster="cluster1",ambari_target="host",cpu="total",mode!="idle"
  }[2m])
)
This example sums non-idle CPU time rates from the aggregate CPU series; it is not a pre-normalized utilization percentage. For ready-made capacity/utilization panels, use the packaged Linux dashboards.
Use And Customize Dashboards
The packaged catalog contains eleven dashboards: Linux Fleet Overview, Linux Host Detail, HDFS, NameNode, DataNode, HBase Master, HBase RegionServer, HiveServer2, NodeManager, ResourceManager, and ResourceManager host metrics.
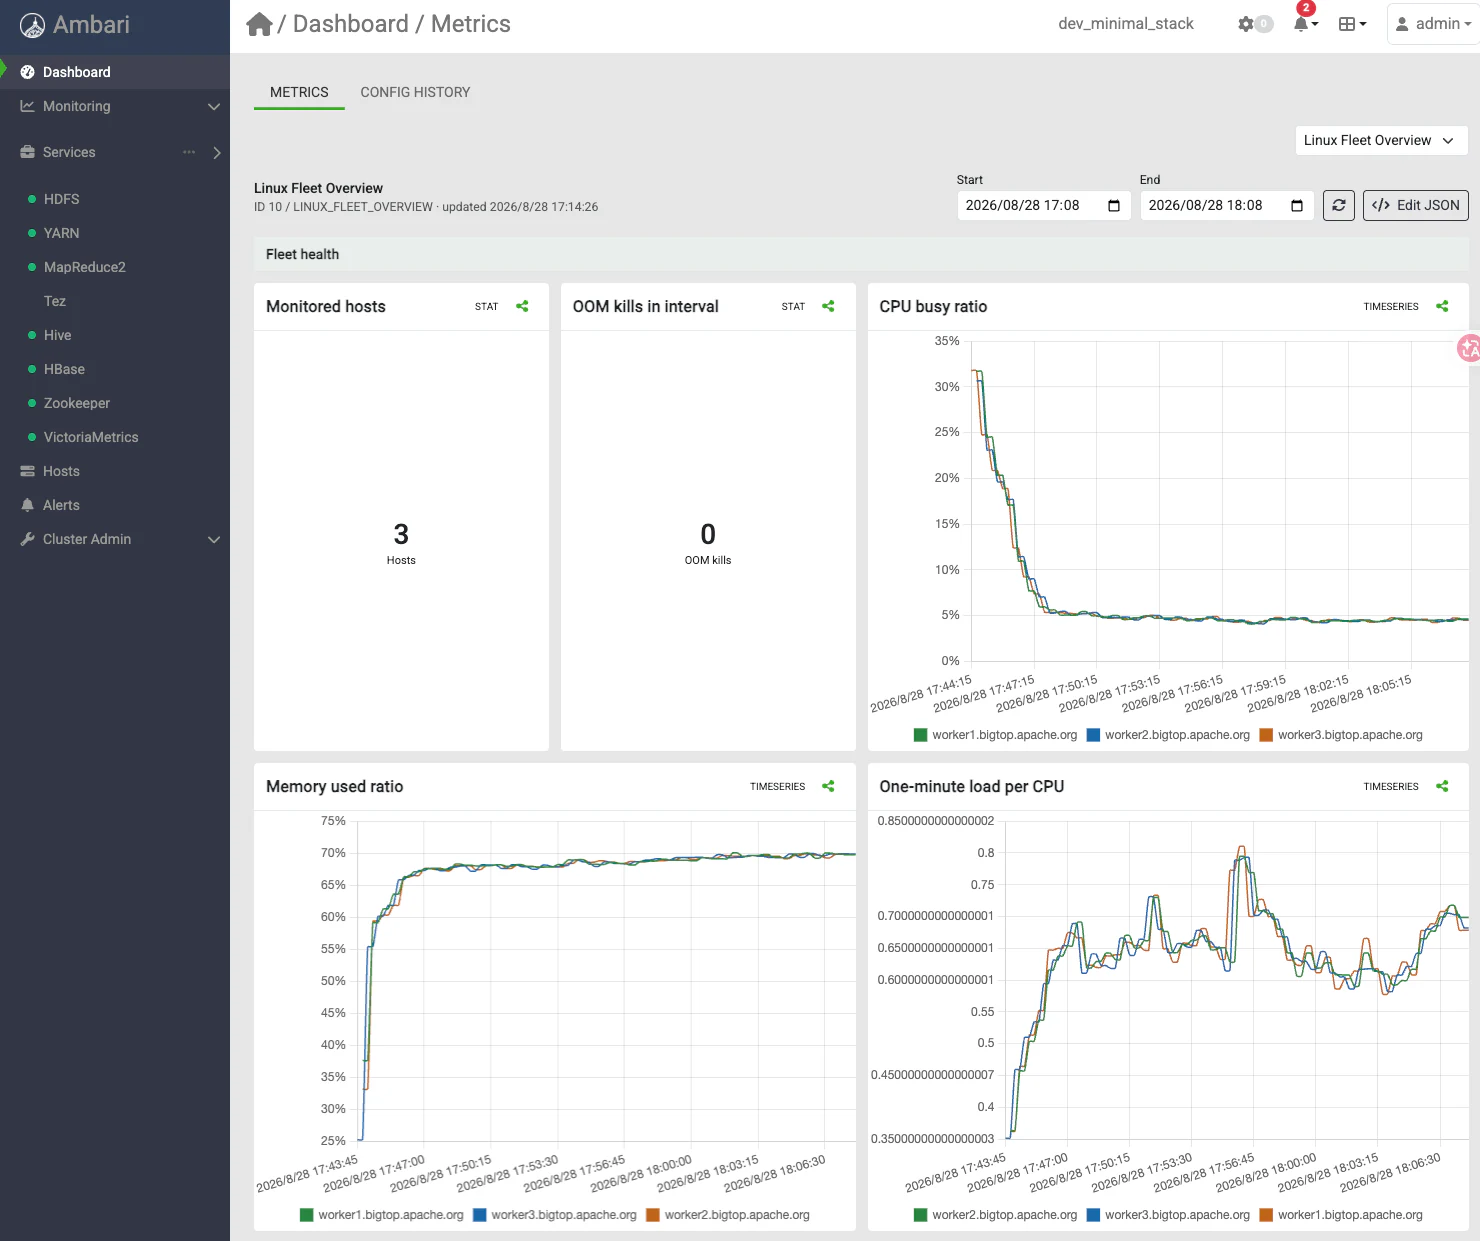
This runtime capture comes from the pinned three-node monitoring evidence. Its values describe that development environment, not a sizing benchmark.
Open a dashboard, choose its datasource/time range, and use its variables to narrow the displayed hosts or components. The service tabs provisioned in this baseline cover HDFS, YARN, HBase, and Hive; other services need their own telemetry and dashboard integration.
The editor supports panel configuration, variables, cloning, JSON import/export, saving, and chart sharing. Keep exported dashboard definitions under version control without embedding datasource secrets. A cloned dashboard can use the packaged queries as a starting point while retaining their cluster and unit conventions.
Ambari binds the reserved cluster variable to the current application cluster and computes __rate_interval as the larger of four query steps or 120 seconds. These reserved variables are not user-editable dashboard filters. Counters use rate or increase; gauges are queried directly.
Workspace Interactions
The following interactions describe the runtime mpack/console development follow-up. Confirm that your installed Web build includes it; the older pinned monitoring evidence above does not by itself establish these newer controls.
Refresh And Time Range
Relative-time dashboards default to a 30-second refresh interval. The preference is stored per user and cluster, including an explicit pause. A paused view offers Resume live updates. Absolute historical ranges and layout editing do not automatically advance.
Queries preserve seconds rather than rounding the end time down to the minute. Time-series axes use the selected query boundaries, including when only one sample is available. After installing collection, allow initial samples to arrive; rate-based CPU or throughput queries need enough observations to calculate a rate.
Read And Control The Legend
A disk-throughput legend entry represents a host, device, and read/write direction. It does not represent every metric from that host.
| Action | Effect |
|---|---|
| Click a series name | Toggle only that curve's visibility |
| Select Only | Display only the chosen curve |
| Select Show all | Restore all returned curves |
| Scroll the legend | Browse the remaining entries without shrinking the plot to fit every label |
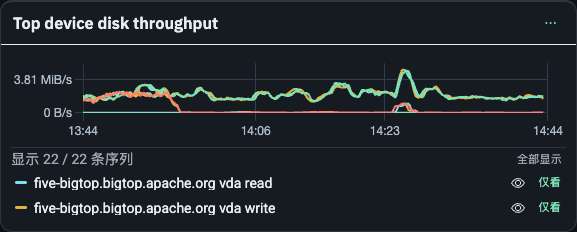
Hidden entries have a crossed-out label and hidden-state icon. The counter shows displayed versus returned series; an all-hidden state has an explicit message. Colors and visibility follow the metric labels and query-target identity across refresh or reordering. In an isolated view, newly arriving series remain hidden. If the selected series leaves the result, use Show all to inspect the others.
These controls affect presentation only. Collection and storage continue. Starting a different query resets that chart's visibility context.
Move From A Chart To Explorer
Open the panel menu and choose View query. Explorer receives the resolved query, datasource, cluster route, and time range. Review them and run the query explicitly.
Explorer distinguishes not-yet-run, loading, successful results, no matching series, and query failure. Cancel stops the in-flight request, and a late response from a superseded context must not replace the current result. Editing inputs marks existing results as belonging to the previous query until another query completes.
Use the chart/data view controls to inspect results. Recent query history is scoped by user and persistent cluster identity. A browser storage failure does not prevent querying. Keyboard users can run with Ctrl/Command + Enter.
Inspect Targets And Datasources
Targets supports filtering by host, component or endpoint, a needs-attention filter, and a detail drawer. From a target's details, View query carries its exact labels into Explorer.
For the managed VictoriaMetrics datasource, the view combines Ambari service discovery with stored scrape success, sample timestamp, and duration observations. It does not ask the storage node to report a separate VMAGENT's targets. Missing, conflicting, foreign, or older-than-five-minute observations are not shown as healthy; without a reliable recent observation, the state is unknown. An explicit failed scrape differs from an unknown state.
Other datasources retain their native target-metadata behavior. An unsupported metadata endpoint produces an explicit capability message; it must not be treated as an empty successful catalog.
Datasource details show scope, endpoint and whether authentication is configured. Enabled is a configuration setting, not a connectivity-test result. Check the query path, discovery/collection, and service-specific metric coverage separately.
API Examples
The query endpoint below is relative to Ambari's normal /api/v1 base. Use a datasource ID from the datasource list, not a dashboard ID. Keep the query URL-encoded:
export DATASOURCE_ID=1
curl --fail --get --user "$AMBARI_USER" \
  --data-urlencode 'query=up{cluster="cluster1",ambari_target="host"}' \
  "$AMBARI_URL/api/v1/metrics/$DATASOURCE_ID/api/v1/query"
Range queries use the corresponding query_range endpoint with query, start, end, and step. Set the environment variables described in the deployment guide before using this example.
Limits And Recovery
The query boundary limits a query to 65,536 characters, a range to 11,000 points, a batch to 64 queries, datasource responses to 16 MiB, and configured request timeouts to at most 60 seconds. Narrow the time window or increase the query step before retrying an oversized request.
Panel requests cancel when their context changes, and a failed panel does not erase unrelated successful panels. Distinguish empty data from a permission error, unavailable datasource, stale target, or invalid expression. Check Targets, then the Explorer, before changing a dashboard.
Chart sharing is part of Ambari's authorization and cluster-binding model, not a promise of anonymous public access. Test shares with the intended recipient's permissions.
Implementation References
See the pinned Metrics API client, Monitoring screens, and Linux collectors.